


Introduction:
If born on the same day, humans all over the world are not expected to die on the same day. Some are naturally likely to live longer because of where they were born. This phenomenon is defined as life expectancy, the average number of years a person can expect to live.
The disparity in the duration of life is influenced by gender, genetics, access to health care, hygiene, diet and nutrition, exercise, lifestyle, and crime rates. According to the World Bank, the average life expectancy in Nigeria as of 2019 is 54.69 years. On average, a Nigerian can expect to live for 54 years. This value varies for different countries in the world.
This analysis seeks to evaluate datasets on life expectancy and generate several useful insights on life expectancy and its determinants such as schooling, use of alcohol, a country’s Gross Domestic Products (GDP), immunization and healthcare, etc.
Data and Model:
Data Scraping: Data sets on Life Expectancy between 2000 & 2015 and the Total Population of Countries were downloaded from Kaggle. The data was imported into the power bi and then transformed into the power query.
Data Cleaning:
Step 1 - Removal of unwanted Columns Step 2 - Renaming of Column headers Step 3 - DAX function was used to extract the population column from its table in the second data set into the life expectancy table. This was done with the "LOOKUPVALUE" formula. Step 4 - Replacement of null values with 0
Data Visualization:
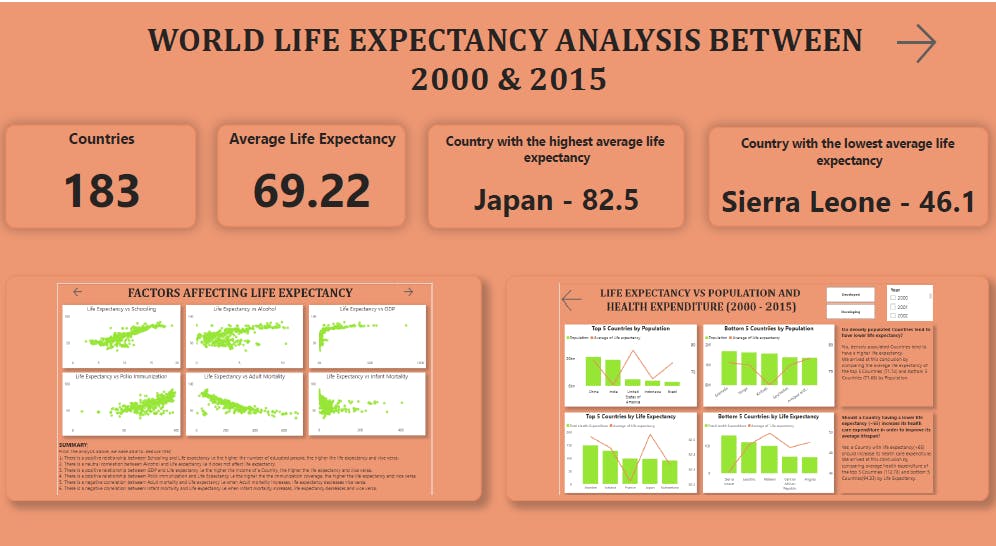
- Cards were used to show the Number of Countries and Average Life Expectancy
- Years and Status were visualized in a slicer in order to use the filtering function
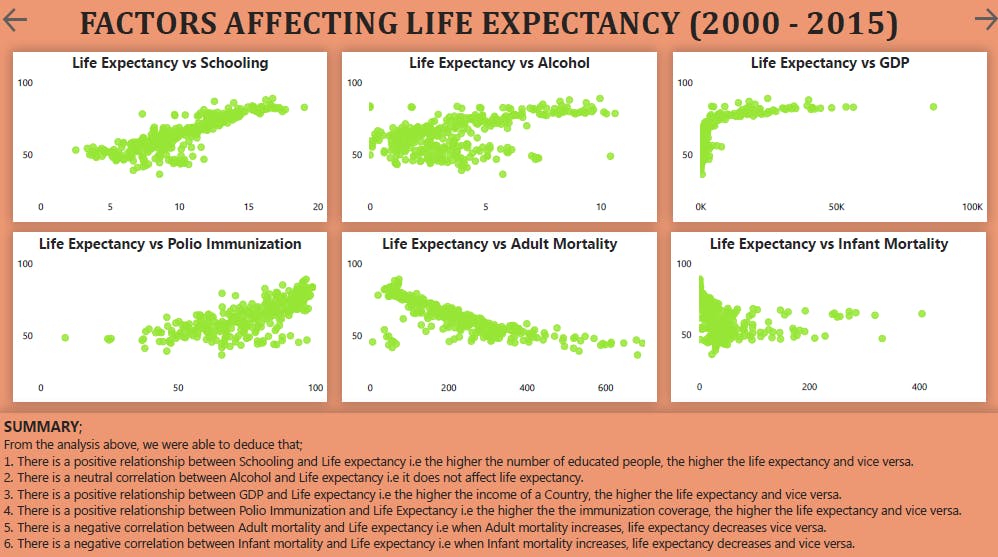
- Visualising Six factors affecting life Expectancy using Scatter Chart
- Line and stacked column chart was used to show the top 5 and bottom 5 Countries by Population to make a conclusion about life Expectancy
- Line and stacked column chart was used to show the top 5 and bottom 5 Countries by Life Expectancy to make a conclusion about health expenditure
- Finally, Textboxes were used to give a summary of the charts and to answer some questions.
- Bookmark was used on the page as a shortcut to navigate to other pages in the report.
Result:

Conclusion:
The country with the highest life expectancy was Japan with 82.5years and Sierra Leone had the lowest with a life expectancy of 46.1years.
There was a positive correlation between life expectancy and schooling, polio immunization, and GDP.
There was a neutral correlation between the use of alcohol and life expectancy.
It was noted that densely populated countries have a higher life expectancy. Countries with higher total health expenditure had higher life expectancy, thus it is advanced that countries with life expectancy less than 65 should increase health expenditure. This will likely improve life expectancy.
It is advised that people, especially those living in countries with low life expectancy engage in factors that are associated with increased life expectancy such as getting a quality education and immunization.